
Income/Expense IQ Report
Improve your financial performance. Build better budgets. Stay competitive.
Income/Expense IQ is the only asset management and property data platform that’s powered by partnership. With property data from BOMA, IREM, and NAA, I/E IQ is more holistic and powerful than ever. Build better budgets for any asset class in any market with I/E IQ.
What is Income/Expense IQ?
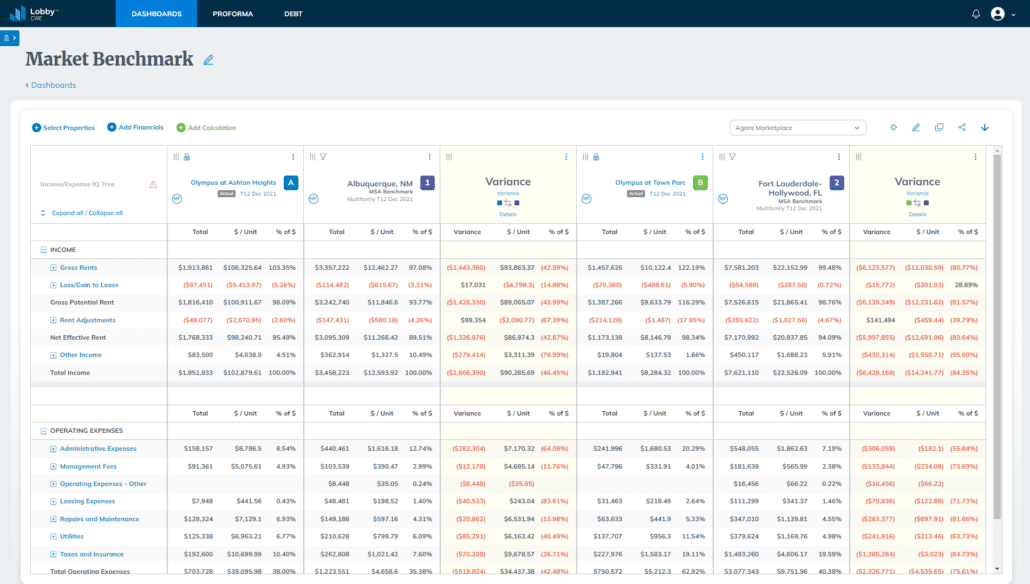
Income/Expense IQ, the new Experience Exchange Report (EER), provides you with nationwide, real-time property benchmarks—giving you actionable insights to identify opportunities and optimize financial performance. Download benchmarks in one, five, ten, or all metro areas to pinpoint opportunities to enable you to operate more efficiently and drive value for your owners and tenants.
Benchmarking Made Easy
Submit Your Building Data
Your information is protected within our secure platform and available for you to extract maximum value. All data you add to Lobby CRE is yours and isn't shared without your consent.
Select Your MSA
Benchmarks are available for purchase within the portal by metro area and asset class.
Download Your Report
As an I/E IQ data submitter, your free benchmark report includes access to all metro areas for one asset class. Additional benchmarks for other asset classes are also available for purchase within the easy-to-use portal.


Data That Works for You!
Why I/E IQ?
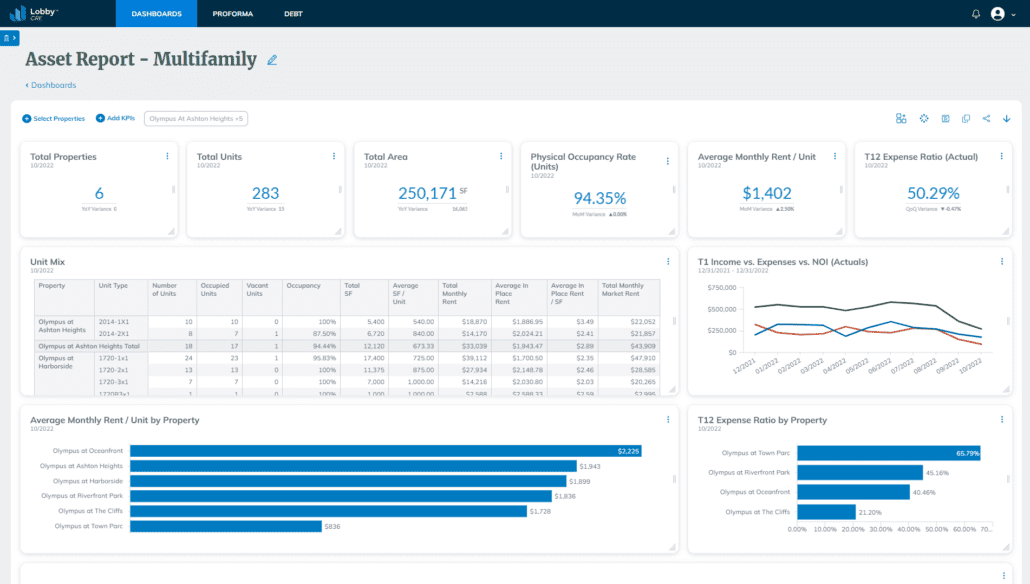
I/E IQ provides you with a dashboard to access benchmark data. Select from asset type and MSA (metropolitan statistical area) and gain property performance insights to build better budgets faster.
Users can even download financial comparison benchmarks into Microsoft Excel which includes:
Total Income:
Income analysis, including gross rents, loss/gain to lease, gross potential rent, rent adjustments, net effective rent, and other revenue input.
Total Operating Expenses:
Operating expenses including administrative expenses, management fees, leasing expenses, repairs and maintenance, utilities, taxes, insurance, and other important expense inputs.
Net Operating Income (NOI)
Platform pricing
Benchmarks are available for purchase within the portal by metro area and asset class.
- 1 metro area, one asset class: $49 regular
- 5 metro areas, same asset class: $199 regular
- 10 metro areas, same asset class: $349 regular
- All metro areas, same asset class: $499 regular
Who benefits from I/E IQ?
Your entire team and your portfolio. Empower your staff and management team with nationwide data to build better budgets. Make better business decisions to enhance the value of your properties. Using income and expense data on asset classes in comparative metro areas is one of the best ways to increase cash flow for investors. I/E IQ is the only nationwide platform powered by data submitted by members of IREM, NAA, and BOMA. No one else delivers this level of market intelligence. Owners and investors will appreciate you. And so will your tenants and residents. Sharpen your I/E IQ to benefit:
- Management teams
- Maintenance teams
- Owners and investors
- Residents and occupant

Stay up-to-date with the latest BOMA News
